Achievements
(102-7, 102-10)
¡Deténgase sentado y también sin hacer nada! ¡Cambie todo lo presente usando no deposit bonus casino! ¡No esperes ni un segundo!Results

| 2013 | 2017 | |
|---|---|---|
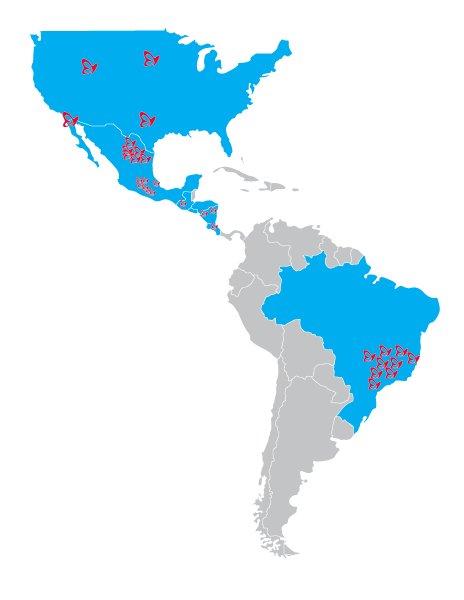
| Countries | 3 | 7 |
| Potencial Consumers | 144 million | 696 million |
| Production Plants | 17 | 32 |
| Net Sales (MXN$ mm) | 43,156 | 62,540 |
| EBITDA (MXN$ mm) | 5,253 | 8,045 |
Income Statement
| 2016 | 2017 | Chge. % | |
|---|---|---|---|
| Net Sales | $53,468 | $62,540 | 17.00% |
| Gross Income | 20,295 | 23,378 | 15.20% |
| Operating Income |
5,248 | 6,175 | 17.70% |
| EBITDA(2) | 6,861 | 8,045 | 17.30% |
| Consolidated Net Income | 4,193 | 3,338 | -20.40% |
Financial Position
| 2016 | 2017 | Chge. % | |
|---|---|---|---|
| Total Assets | $40,832 | $77,891 | 90.76% |
| Cash | 4,266 | 6,733 | 57.83% |
| Total Liabilities | 11,845 | 47,550 | 301.43% |
| Shareholders’ Equity | 28,987 | 30,341 | 4.67% |
Market Data
| 2016 | 2017 | Chge. % | |
|---|---|---|---|
| Price per share | 30.21 | 27.61 | -8.61% |
| Earning per share | 1.67 | 1.31 | -21.67% |
| Dividend per share | 0.54 | 0.61 | 12.96% |
| Book Value per share | 10.96 | 11.64 | 6.20% |
| Outstanding Shares | 2,475.93 | 2,475.93 | 0.00% |
Operations
| 2016 | 2017 | Chge. % | |
|---|---|---|---|
| Employees(3) | 34,866 | 38,393 | 10.12% |
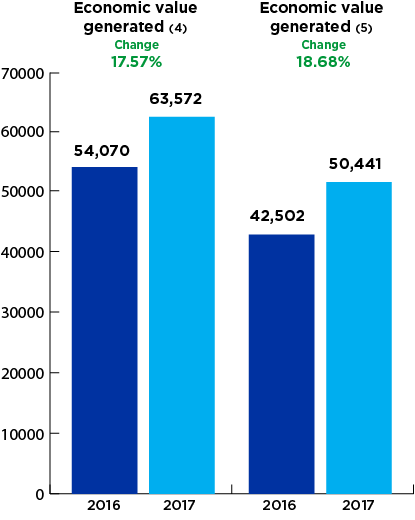
| Economic Value Generated(1)(4) | 54,070.40 | 63,572.00 | 17.57% |
| Economic Value Distributed(5) |
42,502.00 | 50,441.14 | 18.68% |
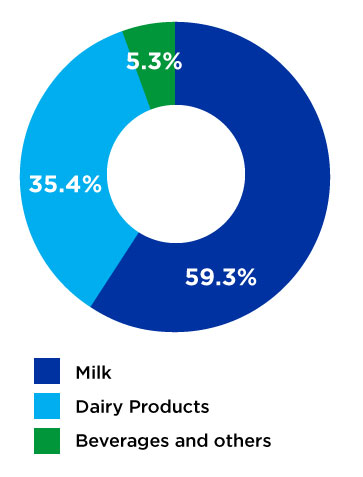
Sales by segment
| Segment | 2016 | % share | 2017 | % share | Chge. % |
|---|---|---|---|---|---|
| Milk | $33,835 | 63.28% | $37,067 | 59.27% | 9.60% |
| Dairy Products | 16,612 | 31.07% | 22,168 | 35.45% | 33.40% |
| Beverages and others | 3,021 | 5.65% | 3,305 | 3.54% | 9.40% |
| $53,468 | $62,540 |
Sales per Segment

Value Creation

$ 65 million
daily trading volume for LALA B
17%
increase in net sales


